Datei:Sonnenstand.png

Größe dieser Vorschau: 800 × 304 Pixel. Weitere Auflösungen: 320 × 121 Pixel | 640 × 243 Pixel | 1.805 × 685 Pixel
Originaldatei (1.805 × 685 Pixel, Dateigröße: 333 KB, MIME-Typ: image/png)
![]()
Diese Datei und die Informationen unter dem roten Trennstrich werden aus dem zentralen Medienarchiv Wikimedia Commons eingebunden.
![]()
Infobox
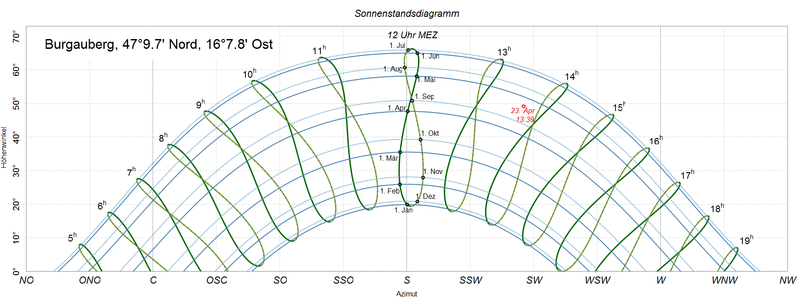
| Beschreibung | ein Sonnenstandsdiagramm für Burgauberg, es zeigt für alle vollen Stunden den Sonnenstand an sowie für jeden Monatsersten den Tagesbogen. Außerdem wird der Sonnenstand an einem bestimmten Tag zu einem bestimmten Zeitpunkt braun eingezeichnet |
| Datum | |
| Quelle | made with en:R_Project, see source code below. values of the constants from http://aom.giss.nasa.gov/srorbpar.html formulas from Blatter's paper: http://dz-srv1.sub.uni-goettingen.de/sub/digbib/loader?did=D241775 or http://www.math.ethz.ch/~blatter/Sonnenuhr.pdf |
| Urheber | Thomas Steiner |
| Genehmigung (Weiternutzung dieser Datei) |
Thomas Steiner put it under the CC-by-SA 2.5. |
| Andere Versionen | eg de:Bild:Sonnenstandsdiagramm Wien 300dpi.png |
Diese Datei ist unter der Creative-Commons-Lizenz „Namensnennung – Weitergabe unter gleichen Bedingungen 2.5 generisch“ (US-amerikanisch) lizenziert.
- Dieses Werk darf von dir
- verbreitet werden – vervielfältigt, verbreitet und öffentlich zugänglich gemacht werden
- neu zusammengestellt werden – abgewandelt und bearbeitet werden
- Zu den folgenden Bedingungen:
- Namensnennung – Du musst angemessene Urheber- und Rechteangaben machen, einen Link zur Lizenz beifügen und angeben, ob Änderungen vorgenommen wurden. Diese Angaben dürfen in jeder angemessenen Art und Weise gemacht werden, allerdings nicht so, dass der Eindruck entsteht, der Lizenzgeber unterstütze gerade dich oder deine Nutzung besonders.
- Weitergabe unter gleichen Bedingungen – Wenn du das Material wiedermischst, transformierst oder darauf aufbaust, musst du deine Beiträge unter der gleichen oder einer kompatiblen Lizenz wie das Original verbreiten.
| Kameraposition | | Dieses und weitere Bilder auf OpenStreetMap |
|---|
R-Code
TODO-list: improve
- real default arguments
- svg file for wikimedia
- global variable for eot=0. different formula?
- automatic xlim (length of longest day)
- check different locations: sun in north at 12?
- find a solution for summertime for the points: is there summertime for a give date at a given location?
- different pagesize for polar and cartesian types. and better pdf size
PNG‑Erstellung
Quelltext
R code
#to adapt change these eight first lines only
locationname="Burgauberg"
phi=47.162
lambda=16.130
out=""        #""/png/jpg/svg/pdf
type="cart"   #cart/polar
lang="de"     #de/en/it/nl
locale="German_Austria" #month names German_Austria/English/Italian/Dutch
ieqot=F       #F/T (do not take equation of time into account)
summert=0     #1/0 (summertime normal time)

if (lang=="de") {
  ltext=c("N","O","S","W","Nord","Ost","Süd","West","Azimuth","Höhenwinkel","MEZ","MESZ","Uhr","Sonnenstandsdiagramm","Zenit","Horizont")
} else if (lang=="en") {
  ltext=c("N","E","S","W","north","east","south","west","azimuth","elevation angle","CET","CEST","","sun chart","Zenith","Horizon")
} else if (lang=="it") {
  ltext=c("N","E","S","O","Nord","Est","Sud","Ovest","azimut","altezza","CET","CEST","","Diagramma solare","Zenit","Orizzonte")
} else if (lang=="nl") {
  ltext=c("N","O","Z","W","NB","OL","ZB","WL","Azimut","Hoogte","CET","CEST","","Zonnestanddiagram","Zenit","Horizon")
}


phi=phi*pi/180
lambda=lambda*pi/180
KAPPA=0.016700
EPSILON=23.4385*pi/180
ALPHA=(360-283.067)*pi/180  #77.6°
Sys.setlocale("LC_TIME", locale)
library("Cairo")    #for nice plot into files
require("plotrix")  #for polar plots (and other stuff?)
require("geonames") #to find the perfect timezone
TZ=as.numeric(GNtimezone(phi*180/pi,lambda*180/pi)[3])  #manual: round((lambda*180/pi)/15)
if (!exists(x="TZ",mode="numeric")) {
  TZ=round((lambda*180/pi)/15)
}
h=function(t,KAPPA=KAPPA,EPSILON=EPSILON,ALPHA=ALPHA) {
  return( sin(t+delta(t,KAPPA)-ALPHA)*sin(EPSILON) )
}

r=function(t,KAPPA=KAPPA,EPSILON=EPSILON,ALPHA=ALPHA) {
  return( sqrt(1-h(t,KAPPA,EPSILON,ALPHA)^2) )
}

mu=function(t,ignore=F,KAPPA=KAPPA,EPSILON=EPSILON,ALPHA=ALPHA) {
  zaehl=-sin(delta(t,KAPPA))+tan(EPSILON/2)^2*sin(2*(t-ALPHA)+delta(t,KAPPA))
  nenn = cos(delta(t,KAPPA))+tan(EPSILON/2)^2*cos(2*(t-ALPHA)+delta(t,KAPPA))
  if (ignore) { res=0 } else { res=atan(zaehl/nenn) }  #ignore the eq of time
  return( res )
}

delta=function(t,KAPPA=KAPPA) {
  return( 2*KAPPA*sin(t)+5/4*KAPPA^2*sin(2*t) )
}

coords=function(t,S,phi,lambda,ignore=ieqot,KAPPA=KAPPA,EPSILON=EPSILON,ALPHA=ALPHA,tz=TZ) {
  s=pi/180*15*(S+lambda*180/pi/15-tz)
  x1= r(t,KAPPA,EPSILON,ALPHA)*sin(s+mu(t,ignore,KAPPA,EPSILON,ALPHA))
  x2= r(t,KAPPA,EPSILON,ALPHA)*cos(s+mu(t,ignore,KAPPA,EPSILON,ALPHA))*sin(phi)+h(t,KAPPA,EPSILON,ALPHA)*cos(phi)
  x3=-r(t,KAPPA,EPSILON,ALPHA)*cos(s+mu(t,ignore,KAPPA,EPSILON,ALPHA))*cos(phi)+h(t,KAPPA,EPSILON,ALPHA)*sin(phi)
  return(cbind(x1,x2,x3))
}

#returns the angle for sperical coordinates
coord2angle=function(coord,filterout=TRUE) {
  diag=sqrt(coord[,1]^2+coord[,2]^2)
  psi=atan2(coord[,2],coord[,1])
  phi=pi/2-atan(coord[,3]/diag)
  azi=pi/2-psi
  hoeh=pi/2-phi
  azi[azi<0]=azi[azi<0]+2*pi
  if (filterout) {
    hoeh[hoeh<0]=NA
    azi[hoeh<0]=NA
  }
  return( 180/pi*cbind(azi, hoeh) )
  ##hoeh=wasserglas(alpha=hoeh,D=wgD,d=wgd,n1=wgn1,n2=wgn2,n3=wgn3)
  ##return( cbind(azi*180/pi, hoeh) )
}

#transforms an angle to a formated date
angle2date=function(w){
  day=(w/(2*pi))*365
  dates=as.Date("2009-01-01")+day
  if (lang=="de"){
  fdate=format(dates, format="%d. %b")
  } else {
  fdate=format(dates, format="%d %b")
  }
return( fdate )
}

#gets the coordinates and returns a nice desciptive string
location=function(long,lat,name) {
  long=long*180/pi
  if (long<0) { longStr=ltext[8] } else { longStr=ltext[6] }
  lon1=trunc(long+0.00001) #to avoid output 14°60' for 15°0'
  lon2=60*(long-lon1)
  lat=lat*180/pi
  if (lat <0) { latStr =ltext[7] } else { latStr=ltext[5] }
  lat1=trunc(lat+0.00001) #to avoid output 14°60' for 15°0'
  lat2=60*(lat-lat1)
  latlon=paste(abs(lat1),"°",abs(round(lat2,digits=1)),as.character("' "),latStr,", ",abs(lon1),"°",abs(round(lon2,1)),as.character("' "),longStr,sep="")
  string=paste(name,latlon,sep=", ")
  return(string)
}

#Analemma for all hours
analemmabogen=function(suntype="cart",phi=phi,lambda=lambda,KAPPA=KAPPA,EPSILON=EPSILON,ALPHA=ALPHA) {
  jz=seq(0,2*pi,length=365*2)-9/365*2*pi
  sz=seq(0,23,by=1)
  for (si in 1:length(sz)) {
    ko=coords(t=jz,S=sz[si],phi=phi,lambda=lambda,ignore=ieqot,KAPPA=KAPPA,EPSILON=EPSILON,ALPHA=ALPHA,tz=TZ)
    ang=coord2angle(ko,filterout=TRUE)

    mitte=ceiling(length(jz)/2)
    sunlines(suntype=type,x=ang[1:mitte,1],y=ang[1:mitte,2],type="l",lwd=3,col="darkgreen")
    if (!ieqot) { sunlines(suntype=type,x=ang[mitte:length(jz),1],y=ang[mitte:length(jz),2],type="l",col="olivedrab",lwd=2,lty="dotdash") }

    #labels of the full hour markers
    stui=substitute(szsi^{h},list(szsi=sz[si]+summert))
    yl=ang[mitte,2]+2.5
    if(sz[si]==12) {
      if(summert==1) { sozeText=ltext[12] } else { sozeText=ltext[11] }
      stui=paste(12+summert,"h ",ltext[13]," ",sozeText,sep="")
      if (suntype=="cart") {
        yl=ang[mitte,2]+4
      } else if (suntype=="polar") {
        yl=ang[mitte,2]+7
      }
    }
    if (suntype=="cart") {
      text(x=1.025*ang[mitte,1]-4,y=yl,labels=stui,cex=1.7,font=2)
    } else if (suntype=="polar") {
      text(x=(90-yl)*sin((1.025*ang[mitte,1]-4)*pi/180),y=(90-yl)*cos((1.025*ang[mitte,1]-4)*pi/180),labels=stui,cex=1.3,font=2)
    }
  }
}

#arc of the sun at one date for different days within a year
tagesbogen=function(suntype=type,jahr,lty="solid",lwd=2,col="steelblue",phi=phi,lambda=lambda,KAPPA=KAPPA,EPSILON=EPSILON,ALPHA=ALPHA) {
  tag=seq(0,24,length=24*60+1)
  for (jt in 1:length(jahr)) {
    tagbogen=coords(t=jahr[jt],S=tag,phi=phi,lambda=lambda,ignore=ieqot,KAPPA=KAPPA,EPSILON=EPSILON,ALPHA=ALPHA,tz=TZ)
    tagb=coord2angle(tagbogen,filterout=TRUE)
    sunlines(suntype=suntype,x=tagb[,1],y=tagb[,2],lty=lty,lwd=lwd,col=col)
  }
}

#highlight the position of the sun on a specific date and time as a red point
highlightpoint=function(suntype="cart",timeofday,date="2009-05-01",phi=phi,lambda=lambda,shift=c(0,-3),col="red",KAPPA=KAPPA,EPSILON=EPSILON,ALPHA=ALPHA,summert=0) {
  reddate=as.Date(date)
  dayofyear=as.numeric(reddate-as.Date("2009-01-01"))
  co=coords(t=dayofyear/365*2*pi,S=timeofday,phi=phi,lambda=lambda,ignore=ieqot,KAPPA=KAPPA,EPSILON=EPSILON,ALPHA=ALPHA,tz=TZ)
  winkel=coord2angle(co,filterout=TRUE)
  sunlines(suntype=type,x=winkel[,1],y=winkel[,2],type="p",lwd=2,col=col)
  if(summert==1) { timeofday=timeofday+1 }
  minofday=formatC(round((timeofday-floor(timeofday))*60), digits=0, width=2, format="f", flag="0")
  timestring=paste(floor(timeofday),":",minofday,sep="")
  if (suntype=="cart") {
    text(winkel+shift,paste(format(reddate,"%d. %b"),"\n",timestring),col=col,cex=1.4,adj=c(0.5,0.5))
  } else if (suntype=="polar") {
    pwinkel=winkel+shift
    text(x=(90-pwinkel[2])*sin(pwinkel[1]*pi/180),y=(90-pwinkel[2])*cos(pwinkel[1]*pi/180),paste(format(reddate,"%d. %b"),"\n",timestring),col=col,cex=1,adj=c(0.5,0.5))
  }
  print(winkel)
  return(winkel)
}

#function that handles both polar and cartesian coordinates
sunlines=function(suntype,x,y=NULL,...) {
  if (suntype=="cart") {
    lines(x,y, ...)
  } else if (suntype=="polar") {
    lines( x=(90-y)*sin(x*pi/180),y=(90-y)*cos(x*pi/180), ...)
  }
}

filename=paste("Sunchart-",type,"-",lang,"-",locationname,".",out,sep="")
if (out=="png") {
  CairoPNG(file=filename,width=1850,height=690)
  #png(file=filename,width=1850,height=690)
  #bitmap(file=filename,type="png16m",width=1850,height=690)
} else if (out=="pdf") {
  pdf(file=filename,paper="a4r",width=0,height=0)
  ##pdf(file=filename,width=(wgD+2*wgd)*pi/2.54,height=5/2.54)
} else if (out=="jpg") {
  #CairoJPEG(file=filename,width=1850,height=690)
  jpeg(file=filename,width=1850,height=690,quality=98)
} else if (out=="svg") {
  CairoSVG(file=filename,width=11,height=11)
}
xlab=c(paste(ltext[1],sep=""),paste(ltext[1],ltext[1],ltext[2],sep=""),paste(ltext[1],ltext[2],sep=""),paste(ltext[2],ltext[1],ltext[2],sep=""),paste(ltext[2],sep=""),paste(ltext[2],ltext[3],ltext[2],sep=""),paste(ltext[3],ltext[2],sep=""),paste(ltext[3],ltext[3],ltext[2],sep=""),paste(ltext[3],sep=""),paste(ltext[3],ltext[3],ltext[4],sep=""),paste(ltext[3],ltext[4],sep=""),paste(ltext[4],ltext[3],ltext[4],sep=""),paste(ltext[4],sep=""),paste(ltext[4],ltext[1],ltext[4],sep=""),paste(ltext[1],ltext[4],sep=""),paste(ltext[1],ltext[1],ltext[4],sep=""),paste(ltext[1],sep="") )

if (type=="cart") {
  plot(c(0,0),c(0,0),type="n",xlim=c(45,315),ylim=c(0,min(90-phi*180/pi+31,90)),xaxs="i",yaxs="i", axes=FALSE, main=ltext[14], cex.main=2.3, font.main=2, xlab=ltext[9], ylab=ltext[10], cex.lab=1.33)
  ##par(mar=c(0,0,0,0),cex=0.33)
  ##plot(c(0,0),c(0,0),type="n",xlim=c(0,360),ylim=c(-5,0),xaxs="i",yaxs="i", axes=FALSE)
  ##box("figure", col="blue",lwd=2)
  #par(mai=c(0.95625,0.76875,0.76875,0.39375))
  #box("figure", col="blue")
  legend(x=45,y=min(90-phi*180/pi+31,90),legend=location(lat=phi,long=lambda,name=locationname),box.col="white",bg="white",cex=1.7)


  xticks=seq(par("usr")[1],par("usr")[2],by=22.5)
  yticks=seq(par("usr")[3],par("usr")[4],by=10)
  axis(1, at=xticks[1:length(xticks)], tick=F, cex.axis=1.33, labels=xlab[3:15],font=2)
  ##axis(1, at=xticks[1:length(xticks)], tck=0.01, mgp=c(0,-1.5,0), cex.axis=1.75, labels=xlab[1:length(xticks)],font=2)
  axis(2, at=yticks, tick=F, cex.axis=1.5, labels=paste(yticks,"°",sep=""))
  grid( nx=length(xticks)-1,ny=NA,col="gray75")
  abline( h=yticks, col="gray75", lty="dotted")
  abline( v=c(90,180,270), col="gray20",lty="dotted")

  box(which="plot",col="grey50")
} else if (type=="polar") {
  polar.plot(length=NA,polar.pos=NA,rp.type="p",clockwise=TRUE,label.pos=seq(45,360+22.5,by=22.5),start=135,labels=xlab,radlab=F,radial.labels="",radial.lim=c(0,30,60,90),show.centroid=F, main=ltext[14], cex.main=2.3, font.main=2 )
  text(x=c(0,0,0,0),y=c(0,30,60,90),labels=c(ltext[15],"60°","30°",ltext[16]),col="darkgrey")
  legend("topleft",legend=location(lat=phi,long=lambda,name=locationname),box.col="white",bg="white",cex=1)
}

#arc on a day: birthdays
jahr=c(113)/365*2*pi
tagesbogen(suntype=type,jahr,lty=4,lwd=2,col="orange",phi=phi,lambda=lambda,KAPPA=KAPPA,EPSILON=EPSILON,ALPHA=ALPHA)

analemmabogen(suntype=type,phi=phi,lambda=lambda,KAPPA=KAPPA,EPSILON=EPSILON,ALPHA=ALPHA)

#daily arc: first half of the year
jahr=cumsum(c(0,31,28,31,30,31))/365*2*pi #one line per month
tagesbogen(suntype=type,jahr,lty="solid",lwd=2,col="steelblue",phi=phi,lambda=lambda,KAPPA=KAPPA,EPSILON=EPSILON,ALPHA=ALPHA)

#daily arc: second half of the year
jahr=cumsum(c(181,31,31,30,31,30))/365*2*pi #one line per month
tagesbogen(suntype=type,jahr,lty="dotted",lwd=2,col="skyblue3",phi=phi,lambda=lambda,KAPPA=KAPPA,EPSILON=EPSILON,ALPHA=ALPHA)

#one point per month, each at 12 o'clock
jp=cumsum(c(0,31,28,31,30,31,30,31,31,30,31,30))/365*2*pi #one line per month
jahresbogen=coords(t=jp,S=12,phi=phi,lambda=lambda,ignore=ieqot,KAPPA=KAPPA,EPSILON=EPSILON,ALPHA=ALPHA,tz=TZ)
angl=coord2angle(jahresbogen,filterout=TRUE)
sunlines(suntype=type,x=angl[,1],y=angl[,2],type="p",lwd=2)
adj=cbind(c(0.9,1,1.1,1.1,0,-0.2,1.2,1.1,-0.1,0,0,0.1),c(1.5,1.7,1.6,-0.2,1.3,1,-0.4,0.7,-0.3,-0.7,-0.7,-0.5))
for (i in 1:length(jp)) {
  if (type=="cart") {
    text(x=angl[i,1],y=angl[i,2],angle2date(jp[i]),adj=adj[i,],cex=1.33)
  } else if (type=="polar") {
    text(x=(90-angl[i,2])*sin(angl[i,1]*pi/180),y=(90-angl[i,2])*cos(angl[i,1]*pi/180),angle2date(jp[i]),adj=adj[i,],cex=0.7)
  }
}

#sun location on a certain day and time
hipo=highlightpoint(suntype=type,timeofday=13+25/60,date="2009-04-23",phi=phi,lambda=lambda,shift=c(0,-3),col="brown4",KAPPA=KAPPA,EPSILON=EPSILON,ALPHA=ALPHA,summert=0)

if (out=="png" | out=="jpg" | out=="svg" | out=="pdf") {
  dev.off()
  print(paste("output written to ",getwd(),"/",filename,sep=""))
}

###
###
## ev paar Zeilen rauf schieben, dient für sonneneinstrahlung abzuschätzen
sunlines(suntype=type,x=c(113,113+180),y=c(0,0),type="l",lwd=3,col="red")
# utitlity function to integrate (is sum up) the sun intensity over one day (and then to sum it up over a year)
besonnung_t=function(jahr) {
  tag=seq(0,24,length=60*24+1)
  tagbogen=coords(t=jahr,S=tag,phi=phi,lambda=lambda,ignore=ieqot,KAPPA=KAPPA,EPSILON=EPSILON,ALPHA=ALPHA)
  tagb=coord2angle(tagbogen,filterout=TRUE)
  resu=tagb[,2]
  resu[is.na(resu)]=0
  resu[tagb[,1] < (113.5) ]=0  #SüdWand noch nicht besonnt
  resu[tagb[,1] > (113.5+180) ]=0  #SüdWand nicht mehr besonnt
  return( mean(resu) )
}

# utitlity function to integrate (is sum up) the sun intensity over the whole year)
besonnung_j=function() {
  sonnensumme=0
  jahr=seq(0,2*pi/365,length=365)
  for (jt in 1:length(jahr)) {
    sonnensumme=sonnensumme+besonnung_t(jahr[jt])
  }
  return(sonnensumme/length(jahr))
}

besonnung_t(jahr=c(94)/365*2*pi)
besonnung_j()
###
###
Dateiversionen
Klicke auf einen Zeitpunkt, um diese Version zu laden.
| Version vom | Vorschaubild | Maße | Benutzer | Kommentar | |
|---|---|---|---|---|---|
| aktuell | 15:47, 5. Jul. 2009 | 1.805 × 685 (333 KB) | Thire | cairoPNG and other minor changes | |
| 14:20, 17. Mai 2009 | 1.805 × 685 (40 KB) | Thire | neue location, better code | ||
| 02:01, 8. Nov. 2008 | 1.805 × 685 (40 KB) | Thire | see code and description page for changes | ||
| 20:51, 4. Nov. 2008 | 1.800 × 680 (41 KB) | Thire | cols, lty, errors, red point one date/time, details. see descr (code) | ||
| 22:35, 29. Okt. 2008 | 1.800 × 680 (41 KB) | Thire | nice red point etc (see desciption page comments) | ||
| 13:55, 26. Okt. 2008 | 1.800 × 680 (43 KB) | Thire | now cols etc (see desc comments) | ||
| 22:36, 20. Okt. 2008 | 1.800 × 675 (35 KB) | Thire | now image: fat lines etc; new location | ||
| 11:32, 19. Okt. 2008 | 2.000 × 750 (44 KB) | Thire | now the new image... | ||
| 16:43, 18. Okt. 2008 | 1.480 × 530 (29 KB) | Thire | {{Information |Description= |Source= |Date= |Author= |Permission= |other_versions= }} | ||
| 02:53, 18. Okt. 2008 | 1.500 × 520 (27 KB) | Thire | {{Information |Description={{en|1=d}} {{de|1=d}} |Source=d |Author=d |Date= |Permission= |other_versions= }} <!--{{ImageUpload|full}}--> |
Dateiverwendung
Die folgenden 4 Seiten verwenden diese Datei:
Globale Dateiverwendung
Die nachfolgenden anderen Wikis verwenden diese Datei:
- Verwendung auf fr.wikipedia.org