# This source code is public domain

import numpy
import matplotlib.pyplot as plt
import imageio

sigma = 5
N = 500
nFrames = 50
numpy.random.seed(0)
d1 = numpy.random.randn(N) * sigma
d2 = numpy.random.randn(N) * sigma

images = []
duration = []
blend = 0.998
for c in numpy.linspace(-1,1,nFrames//2).tolist() + numpy.linspace(-1,1,nFrames//2).tolist()[::-1][1:-1]:
    d1 = d1 * blend + numpy.sqrt(1-blend**2) * numpy.random.randn(N) * sigma
    d2 = d2 * blend + numpy.sqrt(1-blend**2) * numpy.random.randn(N) * sigma

    zero = abs(c) < 1E-4
    if c == -1: duration.append(2)
    elif zero: duration.append(1.0)
    elif c == 1: duration.append(2)
    else: duration.append(0.175)
    cMat = numpy.array([[1,c],[c,1]]) / numpy.sqrt(1+c**2)
    x,y = cMat @ [d1, d2]
    fig = plt.figure(figsize=(3.0,3.0), dpi=100)
    plt.plot(x,y,'.')
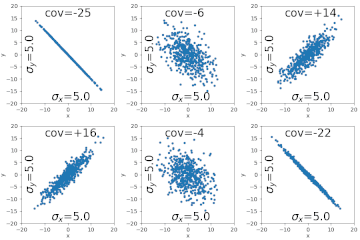
    plt.text(0.25, 0.89, ('cov=%'+('' if zero else '+')+'i')%(c*sigma**2), transform=plt.gca().transAxes, fontsize=20)
    plt.text(0.32, 0.03, '$\sigma_x$=%0.1f'%sigma, transform=plt.gca().transAxes, fontsize=20)
    plt.text(0.03, 0.35, '$\sigma_y$=%0.1f'%sigma, transform=plt.gca().transAxes, rotation=90, fontsize=20)
    plt.xlabel('x', labelpad=1)
    plt.ylabel('y', labelpad=0)
    plt.xlim(-20,20)
    plt.ylim(-20,20)
    fig.subplots_adjust(
        top=0.95,
        bottom=0.14,
        left=0.18,
        right=0.95,
        hspace=0.2,
        wspace=0.2
    )
    plt.xlim(-20,20)
    plt.ylim(-20,20)
    fig.canvas.draw()
    s, (width, height) = fig.canvas.print_to_buffer()
    images.append(numpy.array(list(s), numpy.uint8).reshape((height, width, 4)))
    fig.clf()
    plt.close('all')

# Save GIF animation
fileOut = 'Varianz.gif'
imageio.mimsave(fileOut, images, duration=duration)

# Optimize GIF size
# from pygifsicle import optimize
# optimize(fileOut, colors=6)


